Education business intelligence
Dashboards and reports
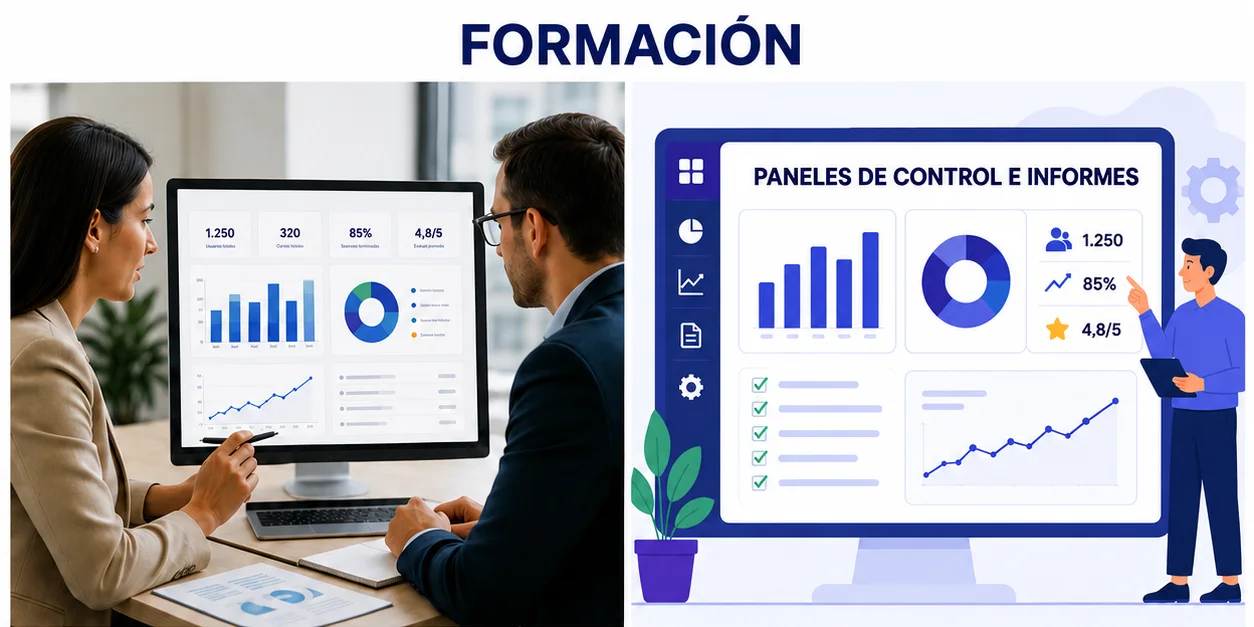
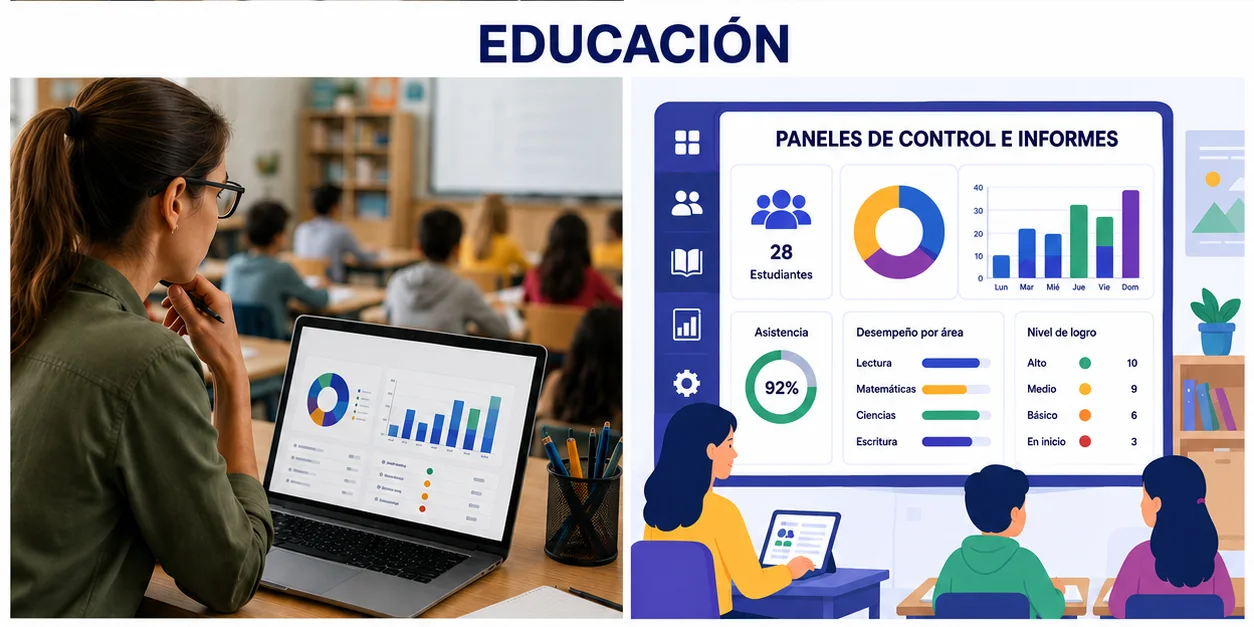
Moving from static grade records to live data dashboards changes the rules. Subjects, competencies, learning, and indicators are consolidated in charts to observe learning status in real time.
Advantages and benefits
- Surface alerts and enable action before students fail or drop out.
- Present outcomes in context, rather than as isolated grades.
- Automate quality reports and reduce manual spreadsheet reconciliation.
- Turn academic data into transparency and retention assets.
Turn results into decisions